I was searching for something here on SF, and I came across this nearly 22-year-old thread, so I thought I'd dredge it up.
After I had my PCs working on
grid.org fighting cancer for years, it folded. So I started them working on
World Community Grid instead. You may recall some of my postings about the WCG in other threads.
But this old thread is a good location for me to post some graphs analyzing my little contributions. So this will be a long story, mainly for my own interest.
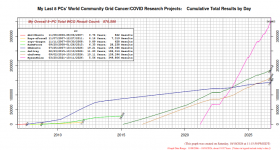
The first two are histories of my various PCs' participation; you can guess about some of their hardware from the device names. First up is the cumulative number of results returned:
A variant of that is the cumulative CPU run-times:
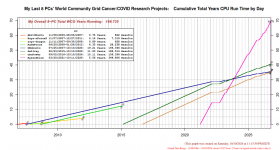
You can tell the number of the devices' cores/threads by the slope of these lines.
You can see in both graphs that they "flat-lined" for a good part of 2022. The WCG used to be hosted by IBM, but they gave it up and it was transferred to the Jurisica Lab at the Krembil Research Institute of Toronto's University Health Network. Since then, there have been various and varying periods of instability in the WCG data-collection from us contributing members and their reporting and information web pages.
Here is a graph of my 4 PCs' daily total run time over the various cores/threads since 2024:
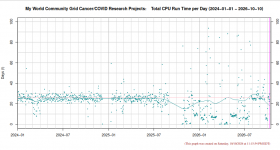
The pink horizontal line is the "expected value" of 26 (1 2-core PC + 2 4-core PCs + the Ryzen's 16 core/threads). Note that the days' run-time totals are determined by how many of the PCs' WCG tasks were received
and "validated". All my PCs usually have many tasks downloaded and cached for running when the CPUs have finished other tasks ahead of them in the queue, so they're almost always 100% busy. But some days, not all the tasks that were finished and reported were validated that day, and the graph's data point for that day might be below expected, but the next day, those tasks might be validated along with that next day's tasks, and the data point might be above the expected.
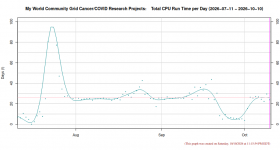
You can see that it was fairly stable through the end of August '25, but then there was about a 1¾ month data gap, and then it "went haywire" through a few days before August '26, after which, I hoped, it would stabilize again. Unfortunately, late last month, we had about 11 days way below average, but I hope those validation problems were corrected. Here's a 3-month graph showing that in more detail: